Using MPLAB X IDE debugger with the simulator
- Intro
- Previous requirements
- Install a program
- Compile and load the project
- Debug the main project
- Conclusion
Intro
This post presents some of the basic features of MPLAB X IDE: how to install a project packed in a zip file, how to compile, run and load a project, and how to use some of the debugging session features. If you are new to MPLAB, this will provide you with the basic skills to develop and test embedded code using Microchip’s hardware and software-
In the following, we will see how to define breakpoints (force the program execution to stop at specific points), to control the program execution and advance step-by-step, and to inspect the value of registers and variables, while the program is running. We will present these features using MPLab X IDE built-in simulator. A previous version of this post uses Digilent ChipKit Max32 in place of the simulator, allowing to control program execution in an hardware device.
Previous requirements
Work described here supposes that you have installed Microchip development tool chain (IDE and compiler) (see this post).
Install a program
First step will be to install a project packaged as a zip file.
- Download the DummyBlik.zip file. This contains a simple project, packaged in a single zip file.
- Extract the zip file contents to your disk. It can be in MPLAB “Projects Folder” or in some other folder. To know the location of the Projects Folder in your installation, follow, from MPLAB’s menu: “Tools > Options > Embedded”. You will then see the current setting for the projects folder. Expanding the zip file creates a
DummyBlink.Xfolder with the required project files. - You should now be able to open the DummyBlink project from the “Open Project” option in MPLAB menu. If you extracted the zip file in a location different from the Projects Folder, you need to navigate to that location.
Compile and load the project
The DummyBlink project is ready to compile and load. To make sure that you are compiling the right project, right-click over the DummyBlink project and select the option “Set as Main Project”. This will guarantee that commands (such as compile, link, load, …) apply to the DummyBlink project.1

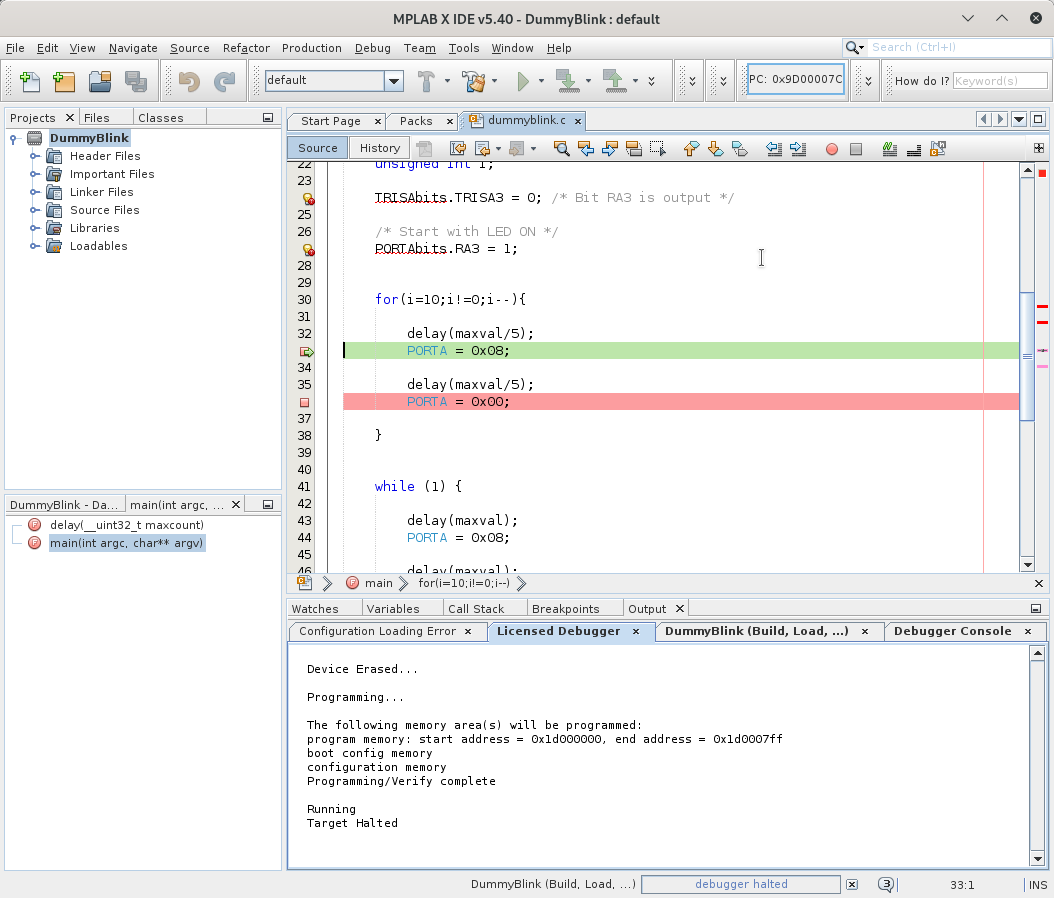
Compile the project (in the menu: Production->Build Main Project, press F11 or click on the “Build” button  ).
).
Debug the main project
Now that the program is compiling, you can now use the debugging features of the MPLAB X IDE.
Configure the simulator
We now need to configure the project to run the code in the simulator. Right click on the project name, in the projects pane, and select “Properties”. If, by some reason, you cannot get to the bottom of the dropdown menu, choose “File->Project Properties” from the main menu.

This will open the Project Properties windows. In that window, select “Simulator” from the dropdown menu in “Connected Hardware Tool” and click OK.

Start a debug session
We are now ready to start using the simulator. Start a debugging session with the “Debug Project” button (or, in the Menu: Debug->Debug Main Project):

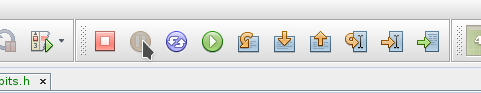
This will load a special version of the the program and cause the debug toolbar to show:

You are now in a debugger session, that provides additional features to control and verify the execution of the program. The “Finish Debugger Session” (Shift+F5 or Debug->Finish Debugger Session), the button with the red square, will terminate the debugger session. Clicking again in the Debug Project button will restart the debugger session.
Click the “Pause” (orange) button. The program execution will stop and several buttons will become available:
Look at the editing window. One of the code lines will have a green background:
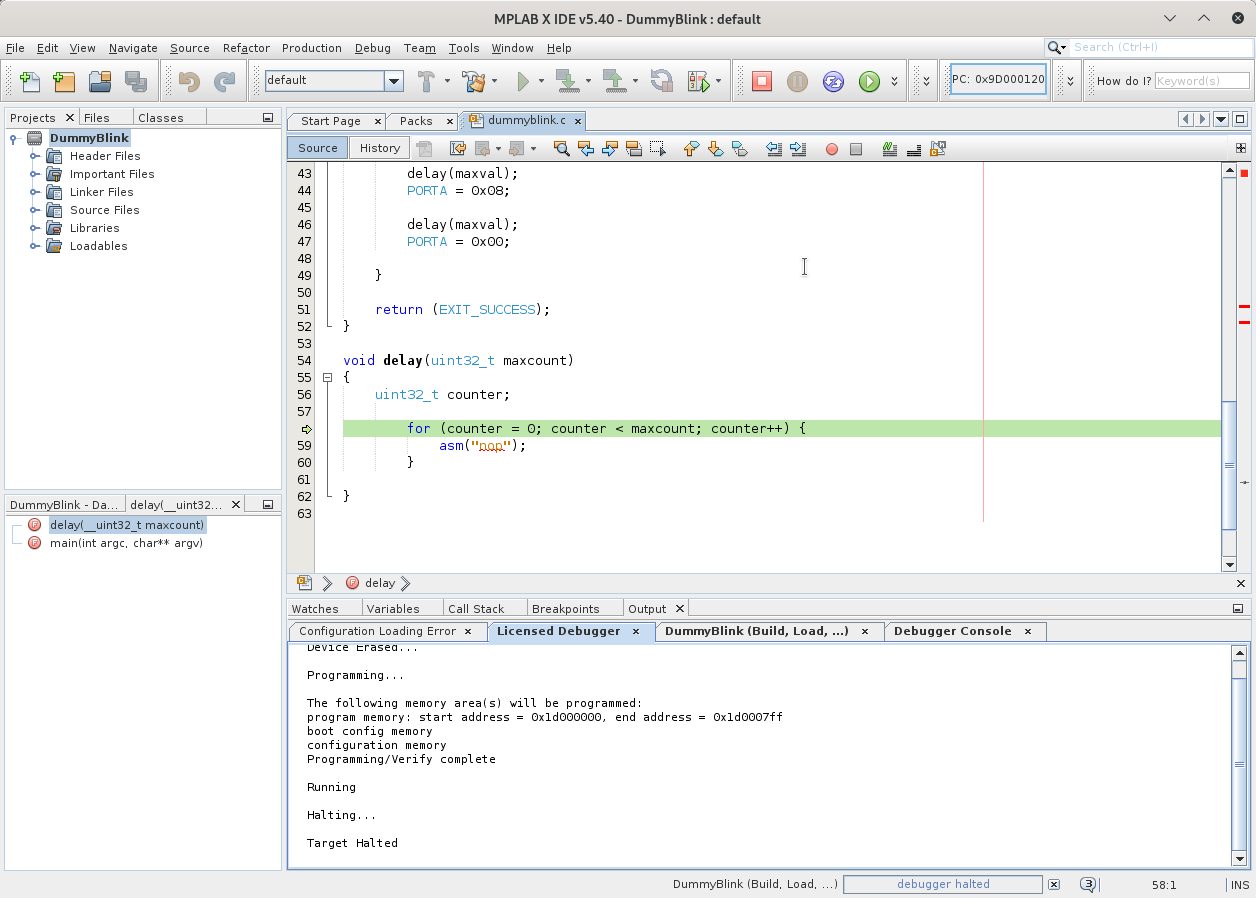
This is the line, in the source code, that corresponds to the instruction that was going to be executed when the program execution was paused.
Pressing the green button (or F5) will resume the program execution. Check the action of the “Pause” (Ctrl+Alt+8) and “Continue” (F5) buttons.
Defining breakpoints
Finish the debugger session by pressing the red square button or by hitting Shift+F5. With the debugger session suspended, click in the number of the lines containing the PORTA assignment instructions, at the left of the editing window. This will make a red square appear over the line number, and the line highlighted in red:
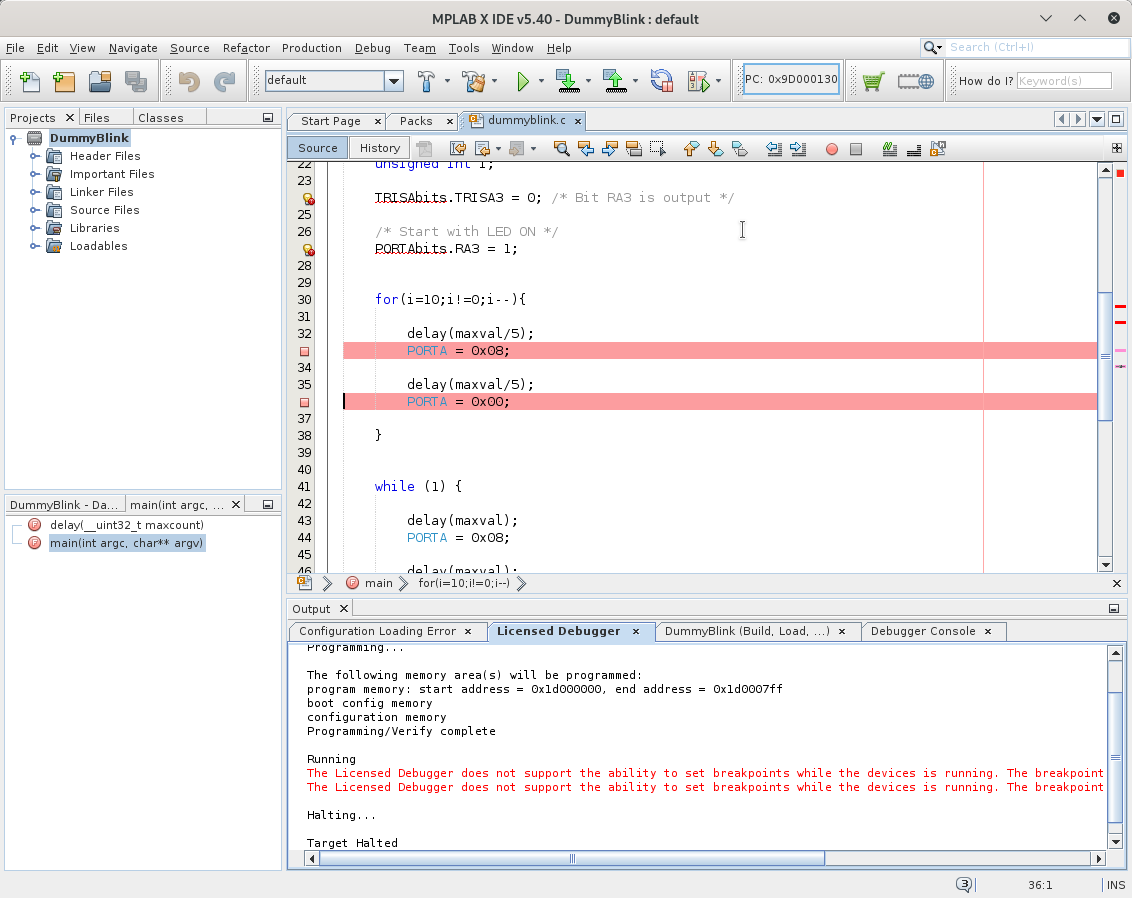
These square marks represent breakpoints, points where the code execution will stop, during a debug session.
Start a new debugger session. The program will stop at the first breakpoint:
As before, the line at which the program stops is signaled in green.
Pressing “Continue” (F5) will resume program execution, stopping at the next breakpoint. Test the program execution by pressing.
Breakpoints can be deleted with the same process they are created. Try to delete one of the breakpoints and create it back again.
Step Over, Step Into and Step Out
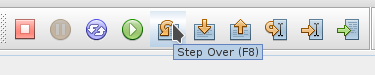
With the program halted at one of the breakpoints, resume the program execution by using the “Step over” (or F8) button:
Press F8 repeatedly and notice how the program execution evolves.
Repeat the procedure using the “Step Into” (or F7) button. Notice the different between “Step Over” and “Step Into”. Notice also that the line beneath the editing window shows the cursor context:

The “Step Out” button (Ctrl+F7) performs the opposite of “Step Into” and causes the program execution to go up one level in the call tree. In this case, “Step Out” allows to leave the delay() function and resume execution in the main().
Other forms of program control
The other buttons in the debugger toolbar allow to control the Program Counter position in different ways. “Run to Cursor” (or F4) makes the program execution stop at the cursor location. It is posible to force the Program Counter to be located at the cursor position by pressing “Set PC at cursor” or to have the cursor located at the current Program Counter location (“Focus Cursor at PC”). “Reset” forces the program to reset. In the case of DummyBlink, reset is visible from the fast blinking at program start.
Checking values in variables and registers
You can check the value stored in a register or variable by hovering the mouse over the variable name during a debug session.

In the case of Registers, you can even check the individual state of each bit:

Adding watches
The debugger session allows, not only to control the program execution but to check the value of variables and registers. This is done my means of watches. With watches, it is possible to read the current value of a register or variable, as well as set its value.
Watches are presented in one of the tabs, beneath the editing window in the default view:
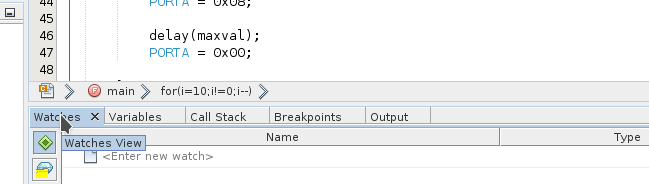
If the watches tab is not visible, enable it in the menu: Windows->Debugging->Watches or by typing Alt+Shift+2.

Watches on registers
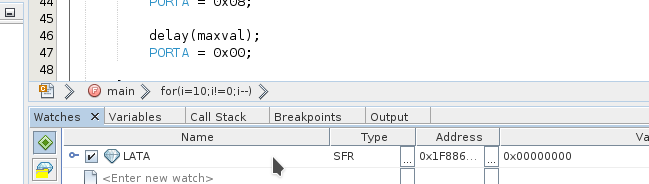
The simplest way to add a new watch is to double-click in “<Enter new watch>” and write the name of the variable or register. In this case, we want to inspect the value being written in port A, so we will have a look at the value of LATA register:
Keeping the two breakpoints at each of the lines that set the value of PORTA, use “Continue” (F5) to advance the program execution and notice the changes in the value of PORTA. By clicking on the “pin” sign to the left of LATA, you can expand LATA and check the value of each individual bit:

The debugger allows also to set the value of registers. Try to change the value of LATA (from 0x08 to 0x00 or vice-versa).To change the register value, simply click on the value box and write the new value.
Watches on variables
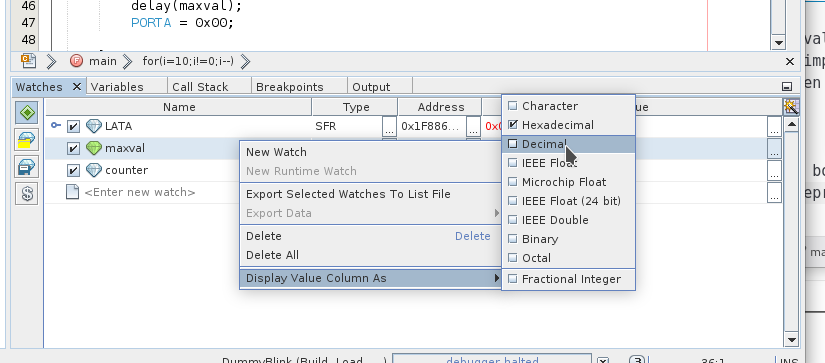
Watches can be set to variables, too. In this case, we will add a watch for maxval. Use the same process as above: click on the box saying “<Enter new watch>”. The value for maxval is displayed in hexadecimal, by default. We can change this representation to decimal by right-clicking on the variable name in the watch tab and selecting the “Display Column Value As” option:
Let us see the effect of changing maxval value. Pause the program (click on the “Orange” pause button or press Ctrl+Alt+8). Most probably, at the pause the PC (Program Counter) will be at a line in the delay() function. In this case, the debugger will not show the value of maxval; it is out of scope. Use “Step Out” (Ctrl+F7) to pause the program in the main() scope. At this point, the value for maxval should be visible. Change maxval to a small value (e.g., 5). Do not forget to press ‘Enter’ to store the value. Continue the program by pressing F7 (Step Into). Selecting Step-Into allows you to execute the code in the delay function step by step and see that the new value for maxval is being considered (if you set maxval to 5, the loop in delay() will iterate only 5 times.).
Conclusion
You now have a grasp of the possibilities offered by MPLab X IDE debugger. Although we have used the simulator, all the operations presented above can be executed when using an hardware debugger, like Microchip’s PicKit 4 or PicKit 3 debuggers or Digilent’s chipKIT PGM Programmer/Debugger.
There are many, more advanced uses of the debugger. You can artificially create stimulus (simulate input values) to the simulator. A specific language, Stimulus Control Language (SCL), exists for that purpose. You can find more information on SCL on Microchip web site or in the folder mplabx/vn.mm/docs in Microchip installation folder, where n and mm are respectively the version and subversion of the installed software. Search for a folder called SCL_Users_Guide.
-
One sometimes annoying feature of MPLAB X IDE is the fact that the last project loaded in the IDE is not necessarily the active project. MPLAB allows for several projects to be opened at the same time. Commands such as Build, Load and Run apply to the main project. When a project is opened in MPLAB, this project is not necessarily set as the main project. A frequent error with MPLAB newcomers is to open a project and start issuing build, load or run commands. If a project was previously set as the main project, the commands will still apply to the “old” project, as it is still the main project, although, for instance, the focus may be on the most recently open project. ↩
Comments
Your comments are welcome. Feel free to leave here your remarks or your opinion!